Hardware Counters for Non-Intrusive Benchmarking - Demistifying the Intel PMU

Hardware counters provided by the Intel performance monitoring unit (PMU) are a great way to obtain metrics such as L1/2/3 cache misses, instructions executed, etc at fine-grained resolution. While there are a number of tools such as linux-perf, VTune, etc. for obtaining said metrics, my (admittedly non-exhaustive) search concluded that there was no good way to obtain hardware metrics for a sub-section of code, as shown below:

int main() {
    /***************************************
    * Initialize array with random numbers *
    ****************************************/
    int n = 1000000;
    long* arr = (long*)malloc(sizeof(long)*n);
    for (int i=0; i<n; i+=1) {
        arr[i] = random();
    }
    /*************************
    *** Code to benchmark ****
    **************************/
    sort(arr, n);
    /*************************/
    return 0;
}

Suppose we only want to benchmark the section of code for sorting while omitting the overhead of initializing the array, I found it difficult to use existing tools in such cases without imposing additional overhead.

This is where the facilities provided by the Intel PMU come in handy.

That being said, Intel's Developer Manual which details how to use the PMU is not the easiest document to decipher. The information pertinent to using the PMU is scattered in multiple places in the manual and the internet. I've put together the relevant information I found in this blogpost.


The Basics


If there is one realization I've had after poring over the Intel manual for a full weekend, it is the following:  
Registers are the interface to the PMU.
That's it.

If you set the right values in the right input registers, you can obtain desired hardware metrics by reading associated output registers. The challenge is identifying what registers to set (program), how to program them, and from where to read the performance metrics. The subsequent sections answer these questions.


How to program MSRs?


The desired performance events can be obtained by programming certain model-specific registers, or MSRs. A useful command-line facility is msr-tools, which provides commands rdmsr and wrmsr to read and write MSRs respectively.

node:~> sudo apt install msr-tools

node:~> sudo wrmsr 0x186 0x43412e

node:~> sudo rdmsr 0x186

43412e


Above, we are programming the MSR at 0x186 to the value 0x43412e. This happens to be the performance event for measuring L3 cache misses.

How to read performance counters?


Now that we have programmed the MSR, where/how do we obtain L3 cache misses? By using the rdpmc instruction. Both Intel CPUs and the Linux kernel support this instruction, and it can be used as follows:
unsigned long rdpmc_l3_cache_misses() {
    unsigned long a, d, c;
    c = 0;
    __asm__ __volatile__("rdpmc" : "=a" (a), "=d" (d) : "c" (c));
    return ((unsigned long)a) | (((unsigned long)d) << 32);
}
rdpmc stands for read performance monitoring counter (PMC in short). There is a one-to-one mapping between MSRs and PMCs. Since we programmed register 0x186 which is the MSR IA32_PERFEVTSEL0, i.e, the zeroth performance monitoring MSR, the corresponding zeroth PMC can be read by passing the argument c=0 to the rdpmc instruction.

To obtain L3 cache misses for a particular section of code, simply read the PMC before and after as follows:
...

unsigned long l3_misses = rdpmc_l3_cache_misses();
<...
code to benchmark
...>
l3_misses = rdpmc_l3_cache_misses() - l3_misses;

...

Exploring the PMU's capabilities 

cpuid is a useful tool to explore the hardware's capabilities. The 0x0AH leaf gives information about the PMU.

node:~> sudo apt install cpuid

node:~> cpuid -1 -l 0x0ah

CPU:

   Architecture Performance Monitoring Features (0xa/eax):

      version ID                               = 0x4 (4)

      number of counters per logical processor = 0x4 (4)

      bit width of counter                     = 0x30 (48)

      length of EBX bit vector                 = 0x7 (7)

   Architecture Performance Monitoring Features (0xa/ebx):

      core cycle event not available           = false

      instruction retired event not available  = false

      reference cycles event not available     = false

      last-level cache ref event not available = false

      last-level cache miss event not avail    = false

      branch inst retired event not available  = false

      branch mispred retired event not avail   = false

   Architecture Performance Monitoring Features (0xa/edx):

      number of fixed counters    = 0x3 (3)

      bit width of fixed counters = 0x30 (48)

Intel CPUs have different architecture families, such as Skylake, Kaby Lake, etc. For instance, the Intel Xeon Silver 4114 10-core CPU belongs to the Skylake architecture family:

node:~> cat /sys/devices/cpu/caps/pmu_name

skylake


There are three types of performance events supported by the PMU:

  1. Fixed counters: The cpuid 0x0AH leaf shows that the version ID of the PMU is 4, and there are three fixed counters supported by PMU. These counters are retired instructions, core cycles, and TSC reference cycles (Table 18-2 in the manual). These three are commonly used performance events and hence incorporated as fixed counters. All PMUs with version ID 2 and higher support these fixed counters, which includes processors since Intel Core 2 Duo T 7700 released in 2007.
  2. Architectural performance events: Aside from the fixed counters, the PMU provides limited MSRs to program performance events of choice. The cpuid leaf shows that there are four counters per logical processor. These MSRs are named IA32_PERFEVTSELx, where x ranges from 0-3 in our case. Some processors can provide up to 8 counters, but the register address of these counters is fixed starting from 0x186 for MSR IA32_PERFEVTSEL0 for all Intel architectures. Architectural performance events have the same event code independent of the PMU architecture family. There are seven such events highlighted in green (Table 18-1 in the manual) typically supported by all Intel PMUs. Note that the first three architectural events are the same as fixed counters.
  3. Non-architectural performance events: Some less frequently used performance events such as L2 and L1 cache misses can be specific to the PMU's architecture family. Programming the MSRs for these events requires looking up the manual for specifications of that particular architecture family.

Enabling the PMU

The PMU is disabled by default, and can be turned on by programming the global performance control register IA32_PERF_GLOBAL_CTRL at address 0x38f. The format of the register is shown below (Figure 18-3 from the manual):


Note that here we assume the PMU version to be 2 or higher, which includes processors since Intel Core 2 Duo T 7700 released in 2007. To enable the fixed counters, we need to set bits 32-34. To enable all the PMCs, we need to set the lower 4 bits since our CPU has 4 available performance counters.

node:~> sudo wrmsr 0x38f 0x70000000f


Instead, if the CPU had 8 available counters, we would set the lower 8 bits.


node:~> sudo wrmsr 0x38f 0x7000000ff


A final step involves enabling the rdpmc instruction for user-level programs. This is optional, but is useful if you want to read performance counters without using sudo.

node:~> sudo echo 2 > /sys/devices/cpu/rdpmc


Enabling Fixed Counters


For PMUs that support fixed counters (version ID 2 or higher), an additional register IA32_FIXED_CTR_CTRL at address 0x38d needs to be programmed. The layout of the register is as follows (Figure 18-2 in the manual):

Each fixed counter has 4 associated bits. Taking counter 0 as example, bits 0-1 enable the counter for programs of different ring levels. Bit 2 is reserved, and bit 3 is set to indicate in case an overflow occurs in the PMC (note that PMC is 48 bits wide, see output of cpuid 0x0AH leaf). The three fixed counters can be enabled for all ring levels by setting the MSR IA32_FIXED_CTR_CTRL as follows:

node:~> sudo wrmsr 0x38d 0x333

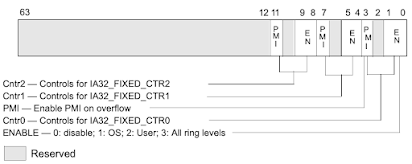
Note that we have not set the overflow control (bit 3), as we are not handling this corner case. For information on how to detect and handle overflow, refer to section 18.2.2 in the manual.

Once the fixed counters have been enabled, they can be accessed as follows:
// Total number of instructions executed (retired)
unsigned long rdpmc_retired_inst() {
    unsigned long a, d, c;
    c = (1<<30);
    __asm__ __volatile__("rdpmc" : "=a" (a), "=d" (d) : "c" (c));
    return ((unsigned long)a) | (((unsigned long)d) << 32);
}

// Total number of core cycles. Note that when CPU frequency
// scaling is enabled (default), time elapsed does not scale
// linearly with core cycles.
unsigned long rdpmc_core_cycles() {
    unsigned long a, d, c;
    c = (1<<30) + 1;
    __asm__ __volatile__("rdpmc" : "=a" (a), "=d" (d) : "c" (c));
    return ((unsigned long)a) | (((unsigned long)d) << 32);
}

// Reference cycles at the rate of the system's time stamp counter (TSC).
// This metric is unaffected by CPU frequency scaling.
unsigned long rdpmc_tsc_reference_cyles() {
    unsigned long a, d, c;
    c = (1<<30) + 2;
    __asm__ __volatile__("rdpmc" : "=a" (a), "=d" (d) : "c" (c));
    return ((unsigned long)a) | (((unsigned long)d) << 32);
}

Programming performance events


Aside from the fixed counters, the PMU provides limited MSRs that can be programmed for the desired performance event. These programmable MSRs are called IA32_PERFEVTSELx (x ranges from 0-3 in our case as Intel Xeon Silver 4114 processors have 4 available counters), and can be programmed for a wide range of events. The layout of these MSRs is as follows (Figure 18-1 in the manual):


A detailed description of all the fields in the counter can be found in section 18.2.1.1 in the manual. Here I will point out two important fields - event select (bits 0-7) and unit mask (bits 8-15). Any desired performance event can be programmed by setting these fields correctly.

For the seven architectural performance events, these two fields can be obtained from Table 18-1 in the manual. For last level cache misses (i.e., L3 misses), the event is 0x2e and the umask is 0x41. We have previously programmed IA32_PERFEVTSEL0 (0x186) to measure L3 cache misses.

Let's take another example. Suppose we want to determine the L3 cache miss rate, we will also need to obtain the number of L3 cache references. There is an architectural performance event for measuring last level cache (L3) references with event 0x2e and umask 0x4f. Notice that the event is the same as for L3 misses, but the umask is different.

node:~> sudo wrmsr 0x187 0x434f2e

Here we have programmed IA32_PERFEVTSEL1 (0x187) to measure LLC references. The corresponding performance counter can be obtained as follows:
unsigned long rdpmc_l3_cache_refs() {
    unsigned long a, d, c;
    c = 1;
    __asm__ __volatile__("rdpmc" : "=a" (a), "=d" (d) : "c" (c));
    return ((unsigned long)a) | (((unsigned long)d) << 32);
}
Notice that the argument c=1 which reads from the PMC mapping to IA32_PERFEVTSEL1.

There are a lot more non-architectural performance events (100+) that are specific to the architecture family. Our CPU belongs to the Skylake architecture family, and the list of events supported are listed in Table 19-3 in the manual. Here I will take one example of L2 cache misses, with event 0x24 and umask 0x3f:

node:~> sudo wrmsr 0x188 0x433f24

Having programmed IA32_PERFEVTSEL2 (0x188), L2 cache misses can be accessed as follows:
unsigned long rdpmc_l2_cache_miss() {
    unsigned long a, d, c;
    c = 2;
    __asm__ __volatile__("rdpmc" : "=a" (a), "=d" (d) : "c" (c));
    return ((unsigned long)a) | (((unsigned long)d) << 32);
}

Conclusion


Intel PMU is a powerful tool for benchmarking with near-zero overhead. There are 100s of useful hardware metrics that can be captured using the PMU's capabilities. I hope that this blogpost will serve as a guide to navigate the Intel manual for programming different performance events.

Response to Comments on our paper "Optimizing Databases by Learning Hidden Parameters of Solid State Drives"

Learning Hidden Parameters of SSDs

We recently wrote a paper on how to learn hidden parameters of SSDs. Commercial SSDs are black boxes, and their internal operation remains hidden from the users. Reverse engineering the internal operation of SSDs is a challenging task given the narrow view into these devices through the block interface. There is no one rule that holds across devices. In our work, we were able to uncover some of the hidden parameters of SSDs from major manufacturers using a systematic set of benchmarks. We used these hidden parameters to improve the performance of SQLite and MariaDB.

Response to the comments

Recently Mark Callaghan wrote a blog post giving comments on our work. Many of his comments were insightful, and I will try to respond to them to the best of my ability:

1. Measuring desirable write request sizes - In a nutshell, we measure desirable write request sizes for an SSD by issuing write requests of different sizes, and measuring the latency of subsequent read requests to the device. The lower the latency of read requests, the better is the performance of the SSD. Here, we are trying to find what write request sizes are best for the device, irrespective of the application’s requirements/performance metrics. This is the first step in understanding the SSDs internal parameters. Mark is right in pointing out that overall database performance goals would be different for different files (for eg. the undo/redo log of InnoDB with sector-sized writes that are rarely read from disk, it doesn’t make sense to optimize for read performance here). What write request sizes to issue to the SSD is a co-decision between the application requirements and SSD parameters, and in some cases, it will not make sense to directly use the SSD’s desirable write request size. In fact, we do mention this at the end of section 3.2.1 in the paper.

2. Difference between desirable write request size and stripe size - We define the stripe size as the "unit of placement decision inside the SSD". Put simply, it is how the SSD decides to break down request data internally. To bring out the difference between stripe size and desirable write request sizes, I will describe my guess about how the Samsung 960 Evo SSD works internally. When a write request is issued to the SSD, it is internally divided into chunks of size 64KB, which are distributed over channels in a round robin manner. Thus, by running experiment 1 in the paper on the Samsung SSD, we find that all files created with a write request size 64KB*i internally have similar layout, and similar read latency. However, when a write request of 32KB (< 64KB) is issued, there are two competing factors. Once again, the 32KB chunks are distributed over channels in a round-robin manner. However, since there are double the number of chunks, the channel level parallelism increases, thus providing higher internal bandwidth. At the same time, the overhead of assembling these chunks to return a single response to a read request also increases, and in the case of Samsung SSD, the former wins out. Its difficult to be sure about the internal operation of an SSD, and one can only speculate about the algorithms used internally. But from an application’s perspective all we need to know is that issuing write requests of size >=32KB is desirable for this device.

3. Indexes issuing larger IO to make use of desirable write request sizes - Mark rightly pointed out that for a B-Tree index, the read/write request sizes are usually small (a few KBs) for desirable write request sizes to be useful. We appreciate his suggestions about indexing structures such as LSM trees, copy-on-write B-Trees, and heap-organized tables in Postgres that issue larger I/O, and we will be looking into them as follow-up work. Studying these data structures with larger I/O sizes in a cloud setting will be an interesting exercise as well, to see how the overhead of transferring data over the network impacts the performance gains.

4. Impact of the kernel, concurrent write requests, and garbage collection - There are multiple factors that come into play when issuing IO requests to a device. The OS block layer and IO scheduler can alter the requests issued by the application --  smaller contiguous write requests can be merged to issue bigger ones, and larger IO requests can be broken down into smaller ones (as described in the document by Jens Axboe). As a less than ideal workaround for the former case, we used the fdatasync system call in one of our experiments where we used hot locations (a hidden parameter) of the SSD. While using hot locations boosted the performance of select operations considerably, the fdatasync system call reduced the performance of insert operations in the case of SQLite. The flipside case of larger write requests being divided into smaller ones is a possibility that remains to be studied. Most of the SSDs we’ve studied so far have desirable write request sizes ~64KB, so as long as the device limitations and kernel configuration do not split a request of such a small size, this might not be a pressing concern. Another aspect to consider is the impact of concurrently issued requests, as they can have subtle effects inside the device. A lot depends on the placement scheme used by the SSD as interfering write requests can change the resulting internal layout of data (and resulting channel-level parallelism) for a file stored on the SSD. This is related to garbage collection (GC) as well, as the preference order of GC in SSDs is same channel compared to across channel (as shifting data across channels is more expensive). More generally speaking, a common concern we encounter here is the ability of the database to control IO requests to the device.

Overall, the possible directions described by Mark -- index structures with larger IO sizes, performance in the cloud, TRIM command in different SSDs, desirable amount of parallelism for an application -- are all great directions for pursuing future work. @Mark: thanks for your comments, and for taking a close look at our work!